What's new.
What's new on Harper — new regions, charts, and forecast improvements.
-
Now, at a glance
The “Now” block at the top of every region page reads as three stat cards: swell, wind, tide. Each card leads with the headline number (height in metres, speed in knots), with the secondary read underneath. Period and direction arrow for swell, cardinal name for wind, rising or falling for tide.
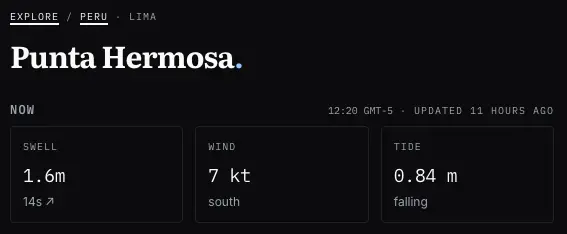
Tide only shows where the region has a tide series. Check it out live in Biarritz.
-
Tide charts
A tide chart now slots in between wind and weather on every region page. Smooth curve, height in metres, plotted on the same five-day axis as the swell and wind charts. A triangle marker shows where you are right now; the line below reads current height, direction, and time — “0.73 m rising — fri 15:00”.
Lets you line up a clean swell-and-wind window with the right stage of tide at a glance.
Check it out live in Gold Coast
-
Weather and wetsuit guidance
Region pages now carry a weather block under the wind chart, four tabs: temperature, sea, rain, pressure. Data comes from Open-Meteo.
The sea tab is the interesting one. Bars are coloured along a wetsuit ramp, with a legend spelling out what to pack: under 12°C is 5/4 plus hood, 12 to 16°C is a 4/3, 16 to 19°C a 3/2, 19 to 23°C a shorty, 23°C and up boardshorts. Travelling somewhere new, one glance tells you what rubber goes in the bag for the week.
-
News comes to you
Harper news now pushes to subscribers. Hit the subscribe button on
/newsand new posts land in whatever app you read blogs, news, or podcasts in (it’s a feed, same plumbing most podcast apps use). No more checking the site to see what’s new.Check it out live.
-
Introducing AI summary
Every region page now carries an “AI summary” block, sitting just under the map. it is a 2 to 3 sentence read on the week’s swell and wind trend, written by a model chewing through the same numbers the charts use. marked beta on the header because we’re still understanding how people use it, and its accuracy.
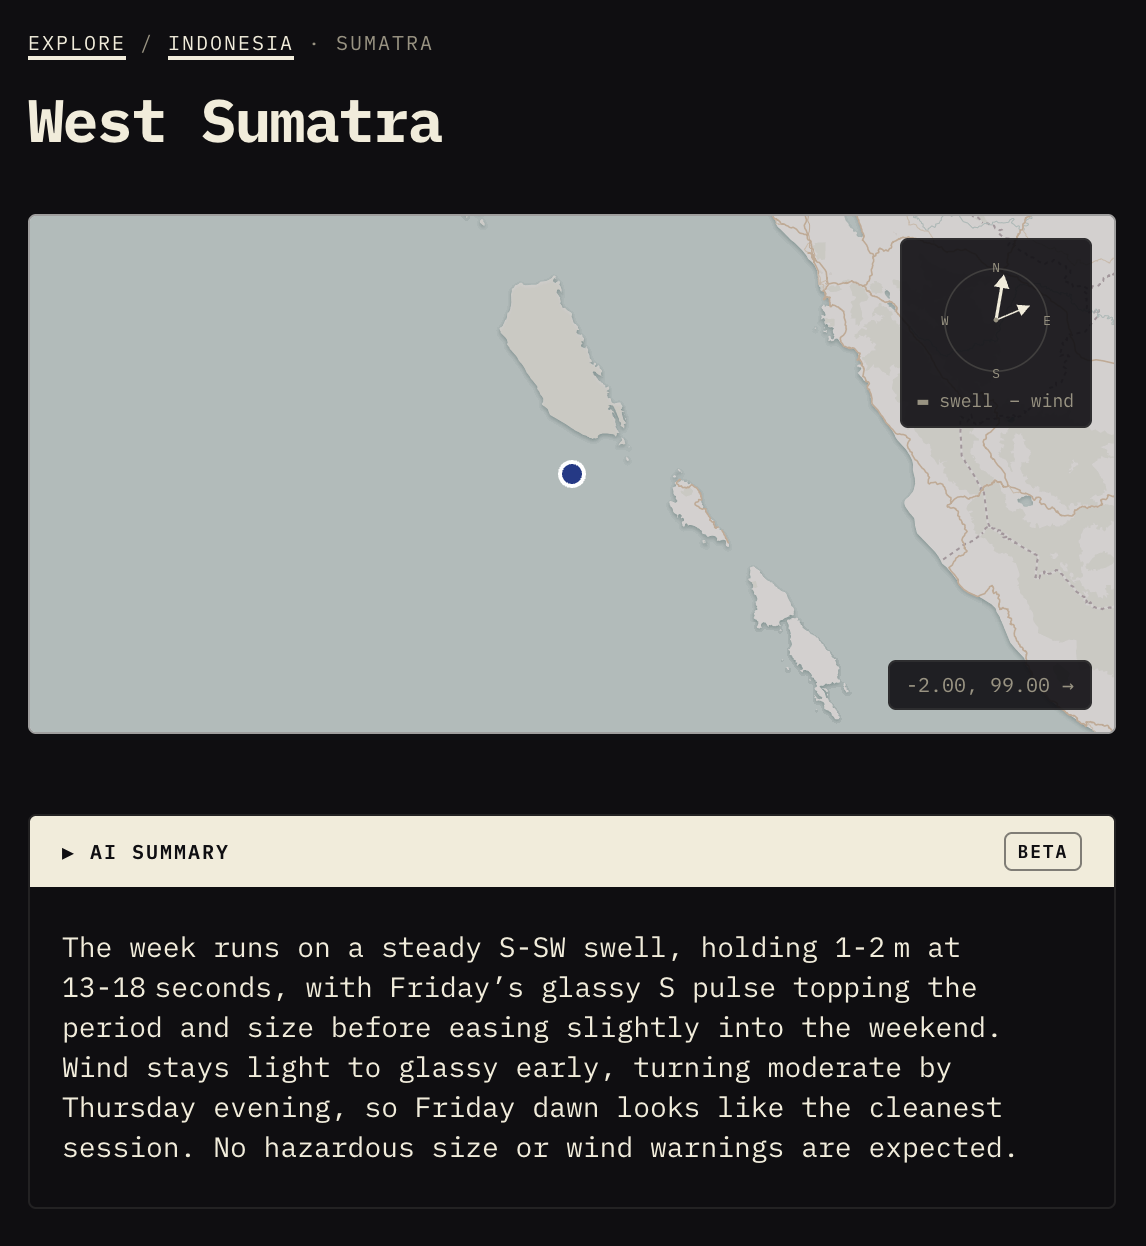
It refreshes three times a day alongside the forecast pull.
Have a squiz and let us know what you reckon. it will be wrong sometimes (that’s why the beta tag is there), but when it nails the week’s story in two sentences, you’ll save yourself a proper stare at the charts.
-
Charts.. colored charts
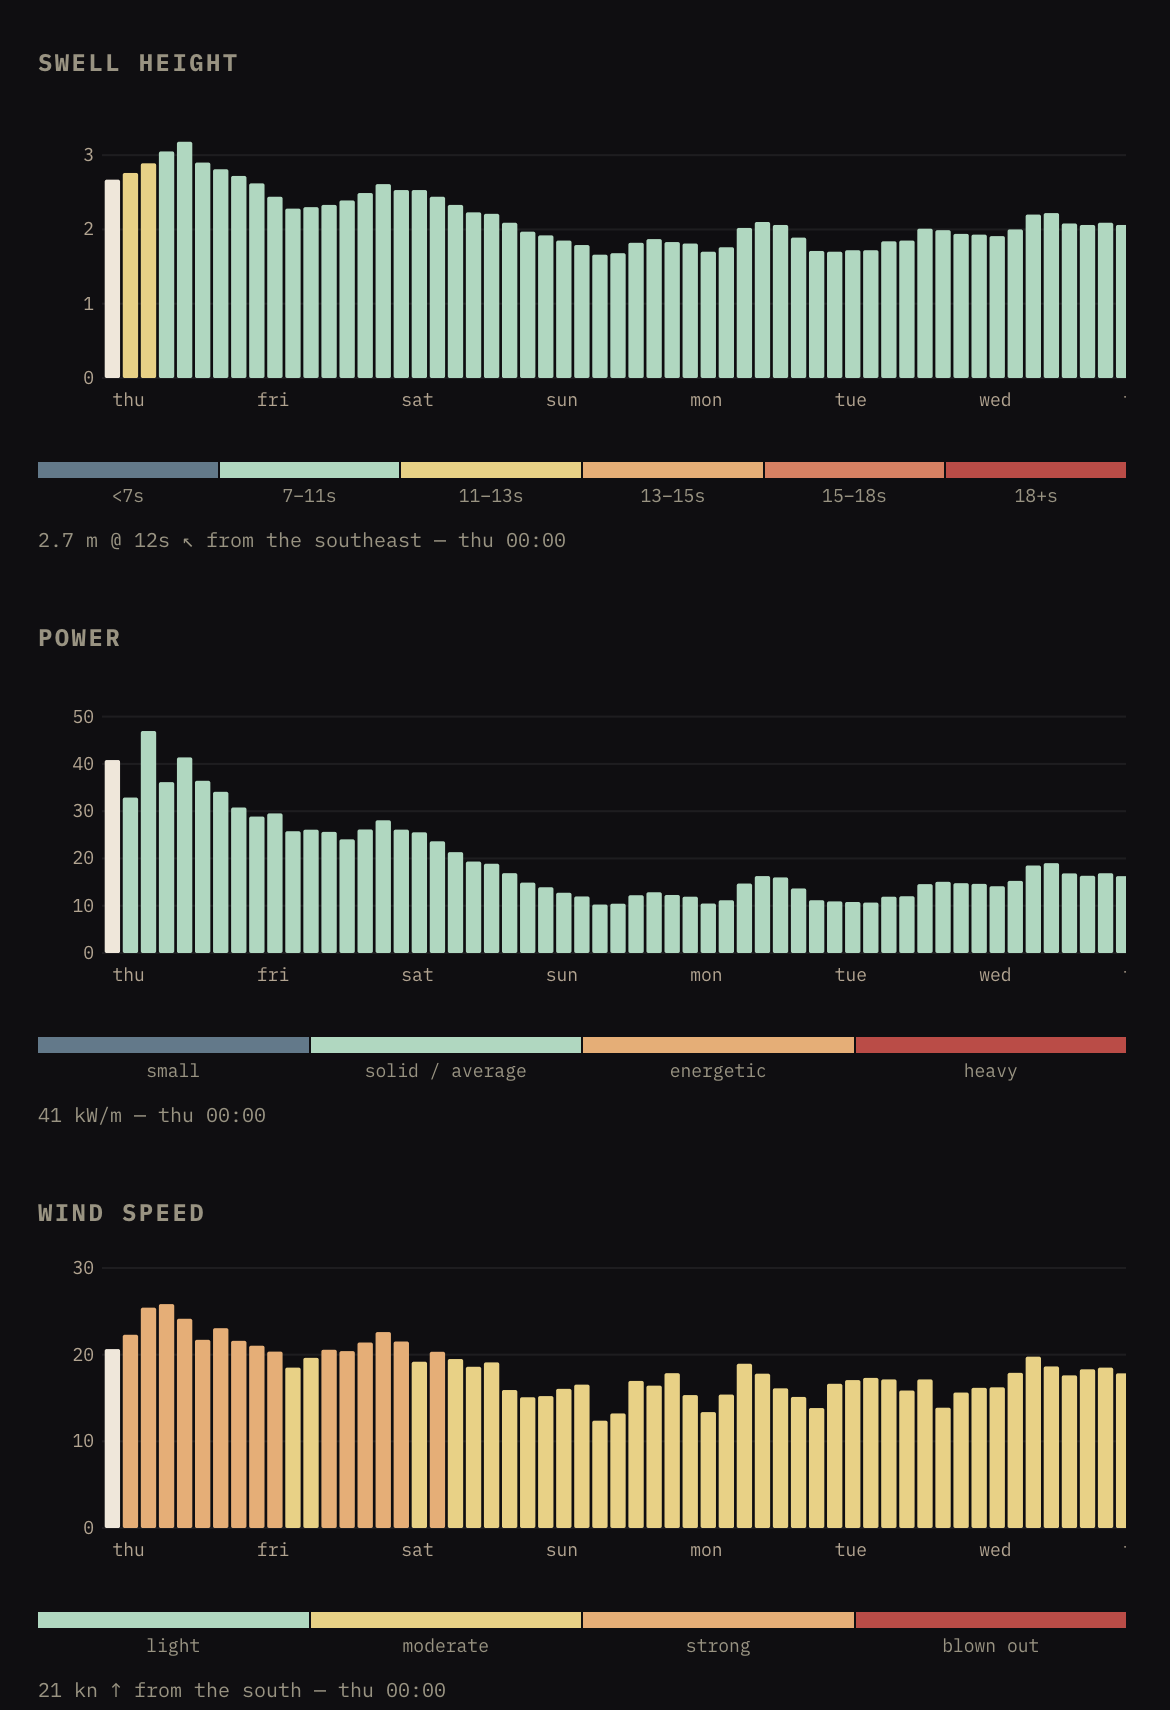
Swell-height bars are now colored by period. short period reads cold blue, long period deep red, with the buckets spelled out in a legend under the chart. one glance tells you size and quality at once, so the standalone period chart is gone.
A new power chart sits between swell and wind, reading in kW/m. it rolls height and period into a single “how much punch” number, useful when you want to know how serious a swell really is before squinting at the other two.
-
New regions
Four new regions on the map — Tibau do Sul, Litoral Norte (SP), Peniche, and West Sumatra.
Click a wave-height bar and it now tells you where the swell is coming from. NOAA doesn’t publish that direction every hour, so the site falls back to the dominant swell when needed.